|
> Classification of Stellar Spectra
|
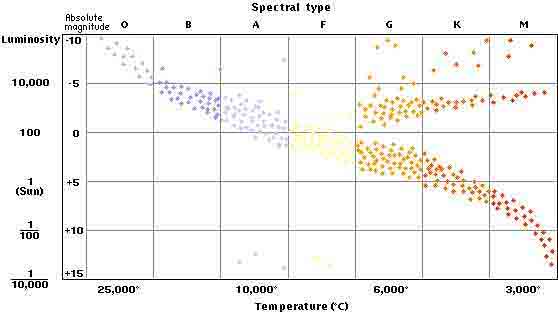
The photographic study of stellar spectra was initiated in 1885 by the American astronomer Edward Charles Pickering at the Harvard College Observatory and carried out principally by the American astronomer Annie J. Cannon. This research led to the important discovery that stellar spectra can be arranged in a continuous sequence on the basis of the relative intensity of certain absorption lines. The observed variations within the sequence provide clues to the ages of the different stars and their stages of development.
Class OThis group is primarily characterized by the lines of helium, oxygen, and nitrogen, besides the hydrogen lines. The O group, which comprises extremely hot stars, includes those showing bright-line spectra of hydrogen and helium, as well as those exhibiting dark lines of the same elements. [Top] Class BIn this group the helium lines attain maximum intensity at the subdivision B2 and fade progressively in higher subdivisions. The intensity of the hydrogen lines steadily increases throughout the subdivisions. The group is typified by the star Epsilon (e) Orionis. [Top] Class AThis group comprises the so-called hydrogen stars with spectra dominated by the absorption lines of hydrogen. A typical star of this group is Sirius, the Dog Star. [Top] Class FThis group comprises stars in which the so-called H and K lines of calcium and the characteristic lines of hydrogen are strong. A notable star in this category is δ Aquilae. [Top] Class GThis group comprises stars with prominent H and K calcium lines and less prominent hydrogen lines. The spectra of many metals, notably iron, are also present. The Sun belongs to this group, and the G stars are therefore frequently called solar stars. [Top] Class KThis group comprises stars having strong calcium lines and lines indicating the presence of other metals. The violet light of the spectrum is less intense, compared with the red light, than in the classes previously mentioned. The group is typified by Arcturus. [Top] Class MThis group comprises stars with spectra dominated by bands
resulting from the presence of metallic-oxide molecules, notably those of
titanium oxide. The violet end of the spectrum is less intense than that
in the K stars. The star Betelgeuse, a Orionis, is typical of this group.
|